Vector Infographic Templates: A Designer's Visual Toolkit
Every project hits a point where information needs clarity. You have data, processes, or concepts to share, but a wall of text won't cut it. That's where a solid set of Vector Infographic Templates and Icons becomes more than a convenience—it becomes a core part of your workflow. This collection is built for exactly that moment, providing a structured yet flexible starting point for visual storytelling.
The personality of these templates is clean, modern, and professional without being sterile. They strike a balance between being visually engaging and maintaining the clarity needed for effective communication. The style leans towards contemporary corporate and digital marketing aesthetics, making them adaptable for a wide range of uses. Think of them as the reliable, well-fitted suit in your design closet—appropriate for the boardroom, the client pitch, and the webinar slide deck.
Where These Visual Assets Truly Shine
The real-world value of these assets lies in their versatility across both digital and print landscapes. For bloggers and content creators, they transform a dense blog post into a shareable, scannable piece. A process infographic can simplify a "how-to" guide, while a comparison chart clarifies product features for your audience. On social media graphics, they stop the scroll. A single, well-designed infographic slide can deliver your key message on Instagram or LinkedIn far more effectively than a paragraph of text.
For entrepreneurs and small business owners, they are a shortcut to professionalism. Use them in pitch decks to explain your business model, in proposals to outline project phases, or in email newsletters to visualize company growth. In editorial design and publishing, they break up long-form articles in magazines or reports, improving reader engagement and comprehension. Even in packaging design, a small infographic can explain product benefits or ingredients in a visually appealing way.
Making Information Intentional and Engaging
Using these templates effectively is about more than just dropping in your data. It's about influencing how that information is perceived. A well-structured infographic creates a clear visual hierarchy, guiding the viewer's eye from the most important takeaway down to the supporting details. This intentional flow enhances readability and ensures your message isn't just seen, but understood.
From a branding perspective, consistent use of these assets contributes to a cohesive brand identity. When your presentations, social feeds, and marketing materials share a common visual language, it builds recognition and trust. The professionalism of the vector graphics—sharp at any size—reflects directly on the perceived quality of your brand. It signals that you value clear communication and attention to detail.
Practical Guidance for Seamless Integration
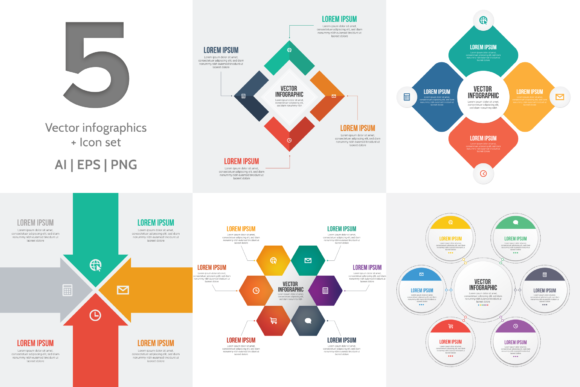
Getting started is straightforward, but a few considerations will help you maximize their potential. First, evaluate the project fit. The included set of 5 vector infographic templates covers common layouts like timelines, pie charts, bar graphs, and process flows. Review them to see which align with your immediate needs.
The package includes both Ai and EPS format files, which are the industry-standard vector formats for professional design software like Adobe Illustrator. This is crucial for true editability—you can scale, recolor, and modify every element without losing quality. The 5 infographics in PNG format are perfect for quick use in non-design software or for web uploads where vector editing isn't possible.
A key feature is that all fonts have been converted to curves. This means the text is no longer live, editable type but is now part of the vector shapes. The benefit? You can easily delete the placeholder text and add your own using any typeface you choose, without worrying about font compatibility or missing fonts. The presentation uses the Bebas Neue and Roboto font families—both excellent, widely available sans serif fonts known for their clean, modern typography.
When adding your own text, consider your font pairing. You might pair Bebas Neue, a strong display font, with Roboto as the body copy for a balanced hierarchy. Or, introduce a complementary serif font for a different feel. Test your pairings within the infographic to ensure legibility at various sizes, especially for data labels and small print.
Remember, these are design assets, not finished products. They are your starting framework. Customize the color palette to match your brand guidelines. Adjust the iconography within the icon set to better suit your topic. The goal is to use the professional structure as a foundation to build something uniquely yours, saving hours of work while maintaining a high standard of visual design.